UNCLASSIFIED // FOR OFFICIAL USE ONLY
ISSACHAR / Common Operating Picture
OVERWATCH
Understanding the Times.

A common operating picture for teams without a SOC.

A browser-based 3D situational awareness tool. A photorealistic globe, seventeen live public-data feeds, and a server-side credential vault. Google Earth meets Palantir — for the operations cell, the mission org, and the small-team analyst who never had access to either one.

Photoreal 3D  //  17+ Live Feeds  //  Browser-Only Client  //  No Keys in the Bundle
Scenario 14:22 LOCAL · CORRIDOR ALPHA
What an Operations Team Sees When the Data Fuses

A three-vehicle aid convoy is rolling north out of Makurdi. The team on the ground sees a road. The operations team, watching Overwatch, sees seven things at once.

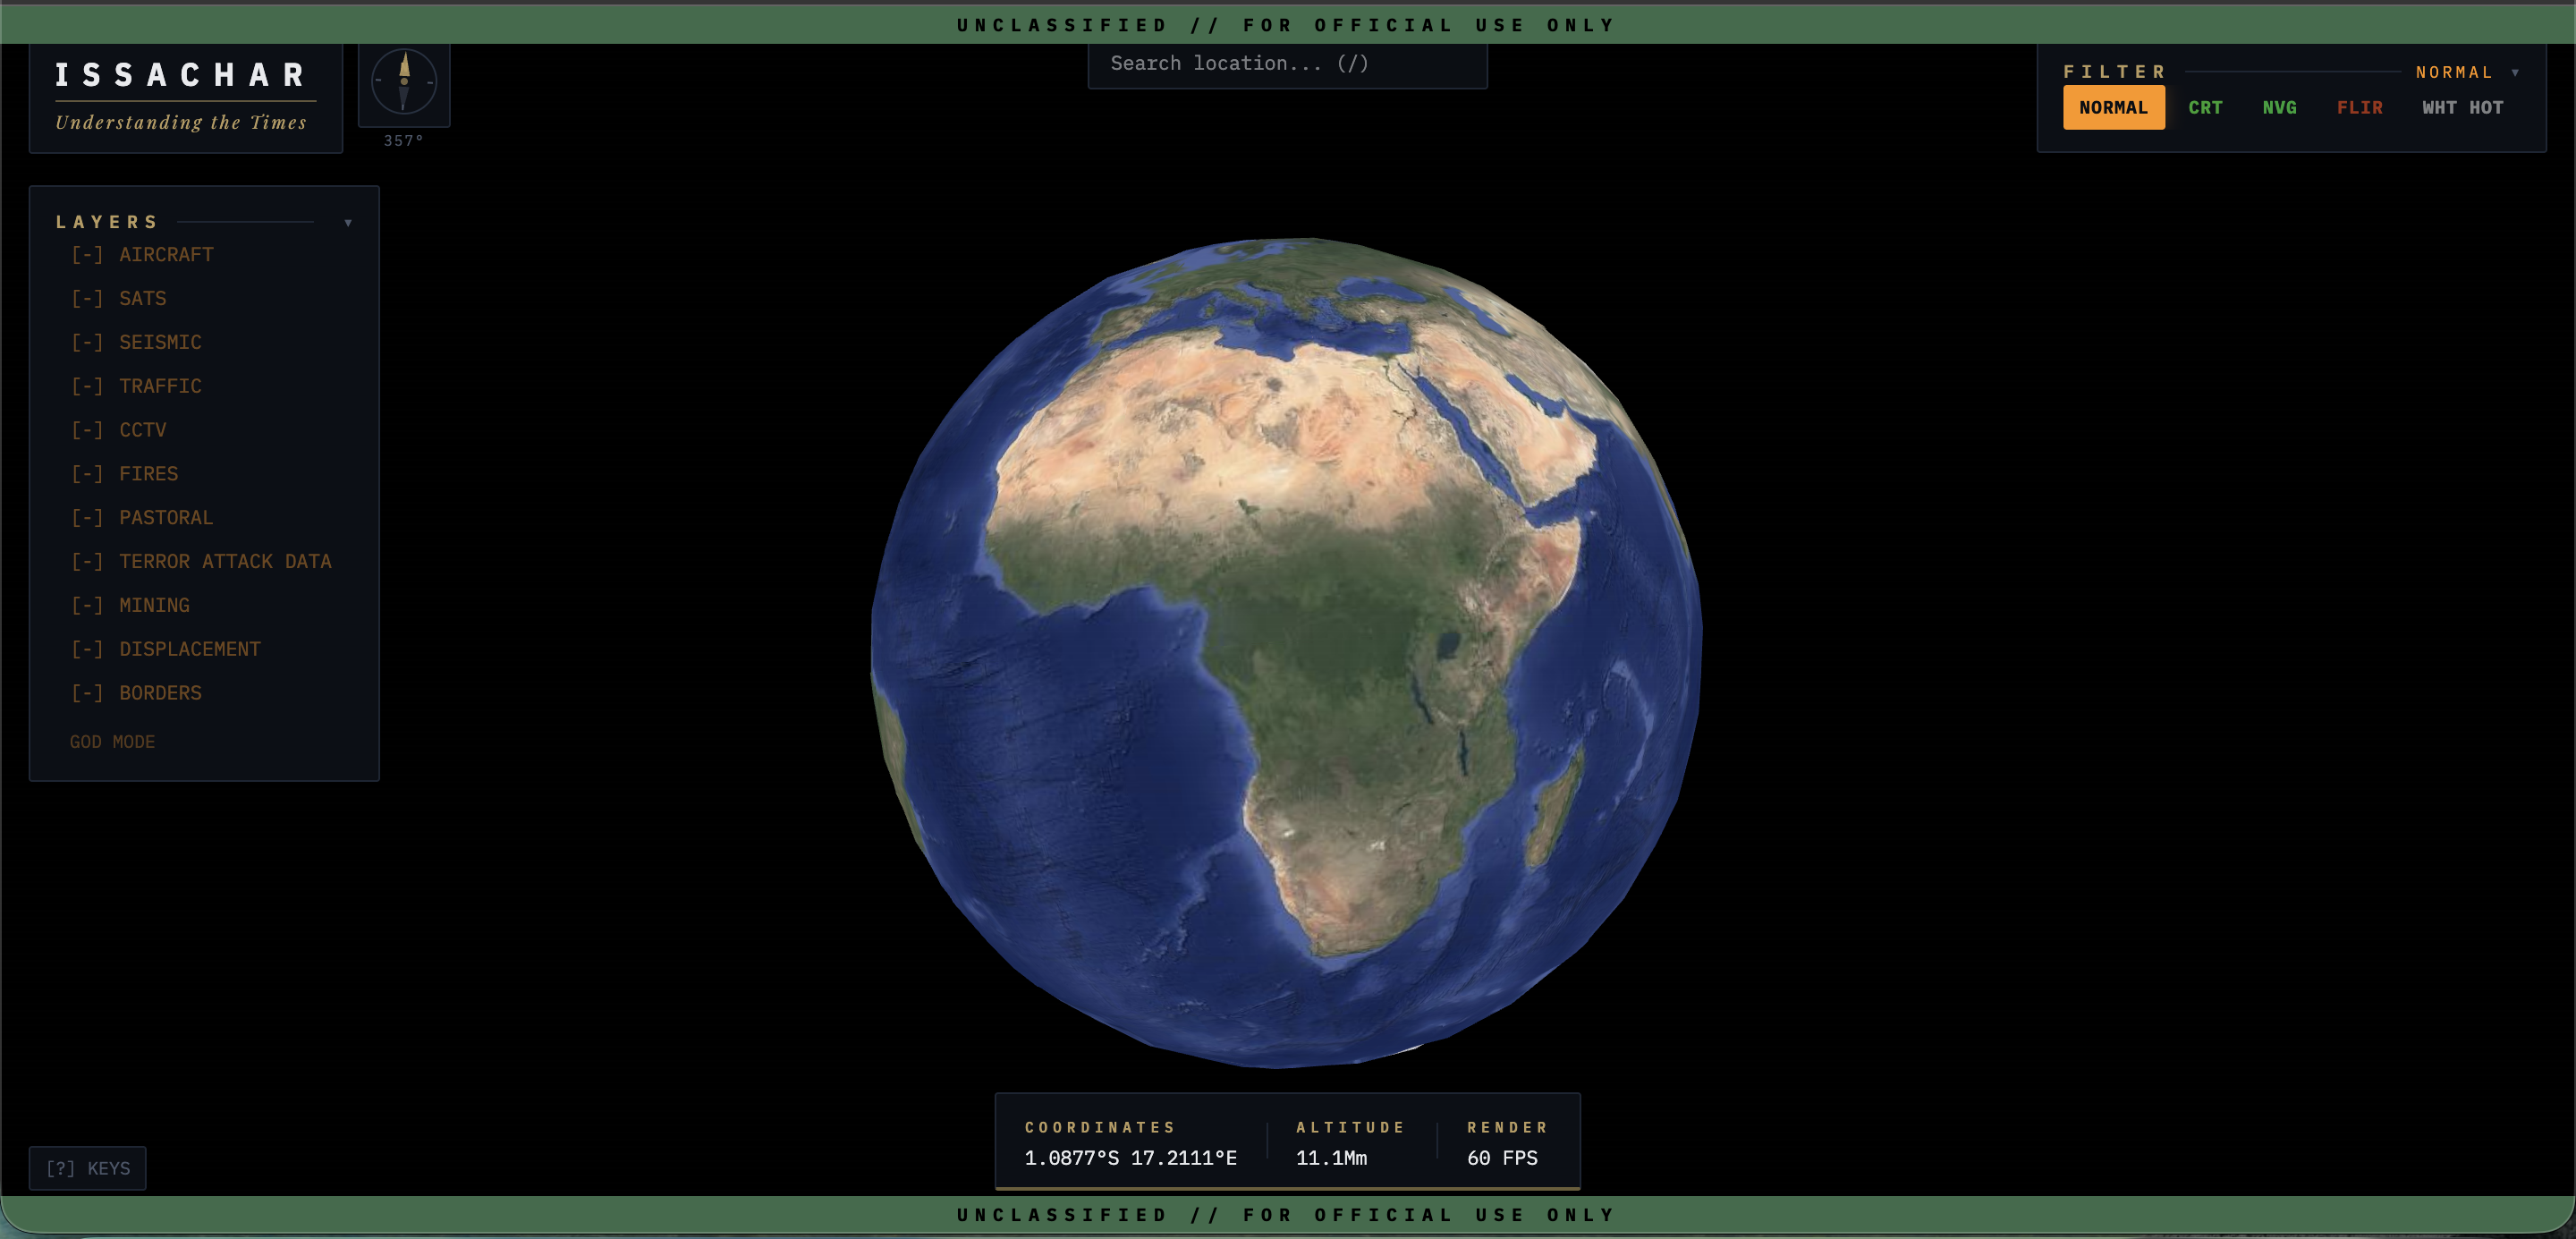
The convoy left thirty-eight minutes ago. Two pickups and a hilux, food and clinic supplies, four staff, a translator, and a community liaison who knows every village inside this corridor by name. They are watching the road. The operations team, two thousand kilometers away, is watching seven feeds layered on top of the same patch of ground.

The first thing they notice is in the sky. A military aircraft has been circling a long oval pattern eighty kilometers west of the route for the last forty minutes — flying at twenty-two thousand feet, no civilian flight plan filed. A public flight-tracking feed has been pushing its position every ten seconds; the consumer flight apps had already filtered it out. The operations team does not know why the aircraft is there. They know it is.

“The ground team sees a road. The operations team sees an aircraft, a fire, a recent attack, and traffic falling off a cliff — on the same map, in the same minute.”

The second thing is a heat signature. A NASA fire-detection satellite flagged a hotspot six kilometers off the route, in the bush north of the corridor, eighteen minutes ago. It was warm when it first appeared. The next pass came through forty minutes later and the same spot of ground is reading hotter. The fire is not out. It is growing. It is also a hundred and twenty meters from a track the convoy will pass.

The third thing is a cluster. Thirty-five kilometers north of the corridor, the violence-incident database has logged four events in the last fourteen days — three of them with fatalities, all of them attributed to militant Fulani groups operating against farming villages along the river. The database categorizes much of this as “farmer-herder”, a framing the team rejects. On the shared map the dots are red, the label reads Fulani militant attacks, and the cluster is moving south.

The fourth thing is invisible until you look for it. The crowdsourced traffic feed on the primary route shows roads going quiet — stretches that should be carrying GPS-traced movement at this hour are not. Traffic has thinned by sixty percent in the last twenty minutes. Locals know something the operations team does not. The fact that they have stopped driving is itself the data point.

A fifth feed, the seismic monitor, is quiet. A sixth, the UN refugee layer, shows an existing displacement site forty kilometers north where the convoy will eventually stop. A seventh, the satellite tracker, shows an imaging satellite passing over the area in fourteen minutes — useful for follow-up imagery if anything happens.

The team makes a call. The convoy reroutes thirty kilometers east, adds ninety minutes to the trip, and goes around the cluster. The team on the ground does not know about the aircraft, the fire, the attack site, or the traffic falloff. They know the operations team told them to turn. Six hours later they are at the clinic site, unloading.

None of these feeds are secret. None of them are expensive. The only thing that did not exist before was the place to put them all on the same globe at the same minute. That place is what Overwatch is.
The Globe PHOTOGRAMMETRIC FOUNDATION

Overwatch is not built on a flat map. It is built on a photogrammetric reconstruction of the surface of the Earth — real buildings with real shadows, real terrain with real slope, real forests, real ocean meshes. Streamed live from Google’s 3D Tiles service, decoded by the same renderer NASA-AMMOS uses for planetary missions, drawn into a scene that runs in any modern browser.

Overwatch interface showing the photoreal 3D globe centered on Africa, with the ISSACHAR sidebar listing data layers (aircraft, satellites, seismic, traffic, CCTV, fires, pastoral, terror attack data, mining, displacement, borders), classification banners, vision-mode selector, and a status bar reading 1.0877°S 17.2111°E · 11.1Mm altitude · 60 FPS.
The Globe · live Overwatch operator view 11.1 Mm altitude · 60 FPS

The reason this matters is simple. A flat tile map shows you where a village is. A photoreal globe shows you what it looks like from the ridge above it — which roads have line-of-sight, which approach corridors are masked by vegetation, where the riverbed cuts, where the high ground sits. Operators read terrain. A globe lets them.

Operational Note
Google Photorealistic 3D Tiles are available globally for most inhabited regions, with the highest fidelity over major urban areas and Western infrastructure. Coverage and resolution degrade in remote or politically restricted regions, and the tileset is not available over certain EEA territories due to local licensing. When the photoreal tileset is unavailable, Overwatch falls back to a satellite raster basemap with hill-shaded terrain — lower fidelity, same data layers.
The Feeds 17+ LIVE SOURCES · FIVE THEMES

The globe is the canvas. The feeds are the picture. Overwatch fuses seventeen-plus public data sources into a single operational view — each one trivially available on its own, none of them useful in isolation. Grouped here by the question they answer.

Theme 01 Sky — what is flying over the ground you care about

Three feeds, one airspace. OpenSky Network pulls state vectors for roughly seven thousand civilian aircraft worldwide on a ten-second polling cadence, fused from ADS-B, MLAT and FLARM receivers. Every state vector carries ICAO24, callsign, position, altitude, velocity, heading and a position-source flag — everything needed to draw a trajectory that an operator can read at a glance.

ADS-B Exchange covers the flights commercial trackers filter out. Military movement, surveillance orbits, tanker tracks, evacuation flights, anything with a callsign prefix like RCH, EVAC, DUKE, or an ICAO24 hex inside a known military allocation. Same state vector, distinct visual treatment, persistent callsign label — because if a military aircraft is loitering near your convoy, you want it to be obvious.

CelesTrak TLE drives the satellite layer. Two-line element sets for active satellites are fetched once a day and fed to satellite.js, which propagates SGP4 / SDP4 orbits client-side every frame. The result is live ground tracks for the ISS, the visual-magnitude catalogue, the Starlink constellations and any other group the operator cares to toggle on — with orbit polylines extending ninety minutes forward and ninety minutes back from now.

OpenSky Network 10 s poll
CelesTrak GP · ISS SGP4 / SDP4
Theme 02 Ground Truth — what is happening to people on the surface

ACLED is the canonical academic record of political violence. Overwatch pulls events — armed clashes, attacks on civilians, riots, abductions — with their actors, fatalities, sources, and geocoded coordinates, renders them as magnitude-scaled red pins, and clusters them on the globe by region. ACLED is updated weekly. Overwatch caches it for an hour at the proxy.

NASA FIRMS handles thermal anomalies. VIIRS and MODIS detections from the last twenty-four hours are rendered as heat-graded points, with brightness temperature and confidence band exposed in the inspect panel. FIRMS is how Overwatch sees fires — the literal kind, and the structural-burn kind that follows an attack on a village.

UNHCR and IOM DTM handle displacement. UNHCR’s population-of-concern API gives country-level totals and demographic breakdowns; the geographic companion endpoint returns refugee-site geometry. The IOM Displacement Tracking Matrix layers site-level IDP counts on top. The terrorattack dataset adds historical and recent attack records geocoded to the incident.

None of these feeds were built to work together. The reason Overwatch exists is so that they can.

ACLED · Event cached 1 h
NASA FIRMS · VIIRS 24 h cache
Editorial Stance
ACLED categorizes much of the violence in Nigeria’s Middle Belt as “farmer-herder conflict” — a symmetrical framing Issachar Analytics rejects. On the Overwatch operational view, these incidents are surfaced under their accurate label: Fulani militant attacks against predominantly Christian agrarian communities. The underlying ACLED record is preserved for source integrity; the analytical label is corrected at the rendering layer. Operators see what is actually happening, sourced from data anyone can audit.
Theme 03 Movement — how the surface is being used right now

OpenStreetMap road geometry, queried through the Overpass API, feeds a custom GPU particle system that animates traffic flow along the actual road graph. The particles do not represent real cars — they represent the road network being alive. When a region of road suddenly empties out, the operator sees a literal absence of flow against a region where flow is still healthy. The data point is the contrast.

Geocoding goes both directions. Forward geocoding through Geoapify and Nominatim lets an analyst type a place name and fly to it. Reverse geocoding lets the operator click an event pin and get back an administrative hierarchy — country, state, LGA, ward. Both run through the proxy so search history stays on the platform, not on a third-party server.

Overpass is also the on-demand detail mechanism. When the operator zooms into a region and asks for local features — clinics, schools, mosques, churches, petrol stations, water points — Overwatch fires an OSM query against the bounding box and overlays the result. Cached for a day. Use it once, never refetch.

Overpass · Roads 24 h cache
Geoapify · Reverse 1 wk cache
Theme 04 Earth — what the planet itself is doing

The USGS earthquake feed is the quietest layer on the globe most days, and the most important one the day it goes loud. Magnitude-scaled markers, depth-coded color, sixty-second polling cadence. When an operations cell is running response in a seismically active region — Türkiye, Indonesia, Nepal, the Andes, the western US — having USGS already on the same canvas as the conflict, fire, and displacement layers means the cell does not have to switch context to a different tool the moment the ground starts moving.

It is also the layer that proves the philosophy. The earthquake feed is free, public, and trivially fetched. It has been free and public for thirty years. The only reason it does not already sit next to the convoy you are running, the camp you are managing, and the airspace you are watching is that nobody bothered to put it there. That is the whole job. That is Overwatch.

RainViewer rounds the theme out with the atmosphere. A two-hour rolling animation of global precipitation radar — storm cells, monsoon fronts, squall lines, dust events — tiled directly onto the globe and refreshed every ten minutes. Operators planning a convoy, an airlift, or a clinic day get the cloud over the ground in the same frame as the seismic events under it. The weather has always been the most consequential variable in field operations; it is now in the same view as everything else that matters.

USGS · M2.5+ 60 s poll
RainViewer · Radar 10 min frames
Theme 05 Social Signals — what the open and federated web is saying about the ground

GDELT is the open-news backbone. Every fifteen minutes the GDELT DOC API surfaces fresh article events from tens of thousands of outlets in over a hundred languages. Overwatch queries it on a five-minute cadence, gazetteer-matches title text to known conflict-zone cities, and falls back to source-country centroids when the article is regional. Article-level metadata — title, source, tone, language, publication time — is preserved through to the inspect panel.

Bluesky rides the AT Proto firehose with an app-password identity. Posts mentioning monitored locations or actors are pulled, geotagged where the protocol exposes it, and reduced to point velocity on the globe. Token state is cached in Redis under a fifty-minute TTL so the credential is decrypted exactly as often as it needs to be.

Mastodon federation is handled through OAuth client-credentials. Overwatch lazy-registers an app on the configured instance the first time the layer is queried, then caches the app credentials and access token indefinitely. Public timeline search across the fediverse is then a single signed request, deduplicated against Bluesky and GDELT before rendering.

Telegram rounds the layer out. A curated list of monitored channels — managed by org admins through the API Keys interface, never .env — is pulled on the same five-minute cadence, with audit functions surfacing membership changes, post velocity, and channel-health signals. The four sources are fused into a single heatmap point cloud, capped at eight hundred points per refresh, and drawn next to ACLED, FIRMS, and displacement on the same canvas.

Missing credentials for any one source — the layer still works. GDELT alone is enough to be useful; every additional feed makes the picture denser.

Social Signal · Fused 5 min refresh
Vision Modes FIVE OPERATOR VIEWS

The globe renders to a single composite canvas, which means every pixel can be transformed by a final post-processing pass. Overwatch ships five of them — three operational, two for briefings. Each is one keystroke away.

Daylight
Default photoreal view. Used for everything that is not specifically planning a night operation or triaging a thermal event.
NVG
Green-phosphor image-intensifier emulation. Used for night operations planning — what the team will actually be looking at through goggles, with realistic scanlines and gain.
FLIR
Thermal heat-map palette, cold-hot inversion toggle. Used for fire triage and structural-burn detection — the FIRMS data layer reads differently against this background.
CRT
Operator-station nostalgia overlay — vignette, scanlines, RGB shift. Used for briefings where the operations-room aesthetic is part of how the call is framed.
White Hot
Grayscale thermal palette — cold reads black, hot reads white. The classic targeting-pod look used when an analyst needs thermal contrast without the rainbow noise of false-color FLIR.
Who It Is For FOUR REAL USERS
User 01
Humanitarian Operations Cell
Two analysts and a duty officer running response across half a dozen field teams in two countries. Already buried in spreadsheets, situation reports, and three different chat tools. Overwatch gives them one canvas for the airspace, ground events, weather, displacement, and routes their teams are actually driving. They do not need everything. They need everything they need on one screen.
User 02
Mission Organization · Fragile Regions
Field teams operating in places where the line between “quiet week” and “evacuation” is short. Leadership in North America needs a real-time read on the regions where their people are deployed — conflict events nearby, military air activity in the area, fires, displacement, road conditions — without paying for a defense-contractor seat license to get it.
User 03
Conflict-Analysis Researcher
A researcher writing on a specific region — the Middle Belt, the Sahel, eastern DRC, the Mexican border — who needs to see how the layers actually relate. ACLED next to FIRMS next to UNHCR next to mining sites, on terrain, on a globe they can rotate. The graphics for the paper come out of Overwatch in whatever vision mode reads best on a printed page.
User 04
Small-Team Security Analyst
One person inside a small NGO or a corporate-security shop, doing the job that, at a larger org, would be split across four people with four tools. Overwatch is the four tools, in a browser tab, for the price of a SaaS subscription. The person stays one person. The output starts to look like a team’s.
Get Involved EVALUATE · PILOT · PARTNER

Overwatch is in early operational use with a small set of partner organizations. If your team is running response, monitoring deployed people in fragile regions, or doing analytical work that deserves better than a tab full of bookmarks — talk to us.

“Of the children of Issachar, men that had understanding of the times, to know what Israel ought to do; the heads of them were two hundred; and all their brethren were at their commandment.”
1 Chronicles 12:32 · Understanding the Times
UNCLASSIFIED // FOR OFFICIAL USE ONLY